Monday, November 23, 2020

Earth’s atmosphere – From a hot cloud of dust and gas to life nurturing environment


The early atmosphere

History of earth – 4.6 billion years. 

Evidences - Oldest occurring rock – Faux Amphibolites of the Nuvvuagittuq greenstone belt - found in Quebec Canada with age of 4.28 billion years. Isotopic analysis of meteorites, soil, rock samples of moon.

Faux Ambibolites (Nuvvuagittuq Greenstone Belt, Eoarchean, 4.28 Ga; western Ungava Peninsula, eastern side of Hudson Bay, Quebec, Canada) James St. John, CC BY 2.0 <https://creativecommons.org/licenses/by/2.0>, via Wikimedia Commons

 The continuous collisions between primordial solar nebula particles (interstellar gas and dust) is mainly considered responsible for the most rudimentary form of earth. This continued for some 150 million years until eventually clumped into a rock form. The mass of earth had very high temperature due to terrestrial accretion heat generated through –

o   Decay of radioactive isotopes

o   Gravitational energy of sinking metals

o   Impact of small planetary bodies bombarding into earth.

 ·         Eventually, rock material started melting bringing about sinking of heavier material rich in iron and nickel, to core and rising of lighter elements to top. The maximum amount of lighter primordial gases like hydrogen and helium escaped during this phase.

 ·      The light molten material crystallized to build initial thin crust. This thin and unstable crust collapsed again formed many times to ultimately form a thicker crust as a result of large scale convection current inside earth. At the same time, outgassing of gases from surface volcanic activity led to oceanic evolution and secondary atmosphere.

Oceanic evolution -

H2O particles were already present in the Earth mass during the planetary accretion phase of formation of earth. During outgassing temporary steam atmosphere was created which precipitated during the subsequent cooling phases of the earth.

Secondary atmosphere –

·         Volcanism was the major route through which degassing of volatile material from the inner Earth took place. Volcanic activity produces water vapor, Carbon dioxide, Carbon monoxide methane gas, nitrogen in substantial quantities but no oxygen.

Decrease in CO2 –

·         Carbon dioxide was the main gas providing heat in the early atmosphere as the early solar system was illuminated by a weak, young Sun that only delivered 75% of the present day energy.

According to a climate model, at 2.75 Ga, CO2 level was 500 times present atmospheric levels. However, by the Cambrian, CO2 levels were close to present atmospheric levels.

The main reason for the extraction of CO2 out of the atmosphere was the development of life forms in the ocean that seized carbon in organic and later inorganic (calcium carbonate) forms and buried it in sedimentary formations on the sea floor.

Evidence -  presence of early carbonated sediments,

        Increase in O2 –

·         The secondary atmosphere formed by outgassing was anoxygenic. Amount of oxygen in the atmosphere increased gradually through

  • Solar radiation - UV rays break H2O into hydrogen and oxygen
  • Organic photosynthesis by earliest form of life - Blue-green algae (Cyanobacteria) uses CO2 and H2O for photosynthesis and release free oxygen.

 ·         Oxygen production continued for 2.2 billion years and did not achieve considerable levels until 2 Ga and only approached present-day levels by 1.5 Ga. Due to chemical action with the material deposited through lava eruptions, such as iron and evaporite formations.

Evidence - Iron rock formation in earliest sediments at Isua in western Greenland aged 3.8 billion years ago. Barite gypsum bearing evaporite found in Pilbara region of western Australia. 3.5 billion years ago.

·         O2 level rose in atmosphere occurred with decrease in the iron deposition.

Evidence – Earliest form of life i.e. Eukaryotes which were present 1.4 billion years ago, require O2 content of about 0.02 present atmospheric level. Similarly, soft life forms like jelly fish, worms developed about 650 million years ago, which require the minimum oxygen level of 0.1 present atmospheric level. Plants first appeared 400 million years ago.

·         The evolution of more complex form of plants and animals extract more CO2 from the atmosphere and provide an additional source of O2.

·         Once O2 started to accumulate in the atmosphere, the production of ozone (O3) could occur, shielding the Earth’s surface from ultra violet (UV) radiation. 


 References –

  • Neil C. Wells - The atmosphere and ocean: a physical introduction, 3rd Edition, Wiley Blackwell
  • Essentials of Meteorology – An Invitation to the Atmosphere, Eighth Edition 2018, C. Donald Ahrens and Robert Henson, Cengage Learning.
  • Brian Frederick Windley (2016) Geologic history of Earth, Encyclopædia Britannica. Available at https://www.britannica.com/science/geologic-history-of-Earth.  Accessed on November 23, 2020


Wednesday, November 11, 2020

Scale of Climatic Events

Thundercloud formation
Formation of Thunderclouds

Climatic phenomenon or events are global feature which occur all over the Earth’s surface. However, their nature, intensity and occurrence may be diverse. The Indian subcontinent may experience monsoonal rainfall while the same may not occur in other parts of the world. Similarly, snowfall may not occur in tropical islands whereas it is quite a normal occurrence in temperate and tundra region. These events occurring in these region are different from each other but are a global happening.

A distinguishing aspect about these climatic events is that they occur along different spatial and temporal scales. To understand this concept, let’s take the example of a climatic event like Amphan Cyclone of May 2020. Super Cyclonic Storm Amphan was a powerful and catastrophic tropical cyclone that caused widespread damage in Eastern India, specifically West Bengal, and also Bangladesh. Amphan super cyclone covered an area of about 700 sq. km., which refers to the spatial scale of the climatic event.

Now Amphan cyclone originated from development of a low pressure area, east of Sri Lanka on 13th May 2020. It intensified and extended over the warm ocean and moved northwards. On 20the May, 2020 the cyclone made landfall in West Bengal. The whole climatic event from origination to landfall took around 7-8 days which is the temporal scale of the climatic event.

Space and time scales of dynamical processes in the atmosphere. Source - UCAR

If we consider the temporal and spatial scale of climatic events occurring in different parts of the world, it is observed that an event with large spatial extent usually has a longer temporal range and vice versa. To understand this let’s look at the following graph by University Corporation for Atmospheric Research (UCAR), where the relationship between spatial and temporal scale of climatic events has been shown. Events like minor turbulence or heat wave covering small area occurs for few hours. Whereas events like Cyclones, planetary waves have a larger spatial extent and hence occur for longer period. So, there is usually a direct relationship between the areal coverage of individual atmospheric event and the time scale in which that occurs.

So considering the spatial and temporal scale, climatic events can be divided into following classes:

• Planetary scale -

• Synoptic scale

• Meso-climate

• Local scale

• Micro-climate

Let’s understand them with their examples -
 

  • Planetary scale – These are the climatic events/phenomenon which occurs over an entire hemisphere or even the entire globe. This is the largest spatial scale possible because it encompasses atmospheric phenomena on the order of 10,000 to 40,000 km. The largest spatial systems mostly operate over the longest time scales, so planetary-scale systems operate over temporal scales that span weeks to months.

Example - Major latitudinal pressure and wind belts that encircle the planet.

  • Synoptic scale - Climatic phenomenon of spatial scale covering about 100 to 10,000 km are synoptic scale events. The systems of this size typically operate over periods of days to weeks.

Examples - Cyclone systems with their associated fronts.

Synoptic scale climatic event Hurricane Irma on Sept. 07, 2017. Source - NOAA's GOES satellite image

  • Mesoscale - Climatic events that operate over areas of about 5 and 100 km. They typically last from a few hours to a few days. It is possible that there exists mesoscale climatic event within a synoptic climatic event. For example, in a cyclone affected area there may be some pocket which does not experience severe activity. These difference may be created by elevation differences, slope aspect, bodies of water, differences in vegetation cover, urban areas, etc.
 Example - Mountain/valley breeze and land/sea breeze circulation systems.

  • Local scale - Local scale climatic events operates over areas between about 0.5 and 5 km — about the size of a small town. The time duration of such an occurrence is few hours or a day at maximum. The local scale activity may be natural as well as caused by human activities. Minor weather changes caused by human activities mostly in urban areas is also a local scale climatic activity.
 Example - A typical thunderstorm also falls into the natural local scale activity. Whereas, occurrence of Urban heat island effect in cities where the city temperature is higher than the surrounding suburban/rural areas, is an example of human induced local scale activity.

  • Micro scale – Climatic events that operate along this spatial scale are smaller than 0.5 km and typically last from a few minutes to a few hours.
 Example - A tree canopy with difference in temperature with surrounding area, wind movement in a forested and deserted area; micro climate of residential buildings as compared to factories are some of the example.

References

      Climatology by Robert V. Rohli and Anthony J. Vega.

      Weather and Climatology by A.K. Sil.

Image by jplenio from Pixabay


Saturday, November 7, 2020

15 Quotes about Geography.

These 15 quotes about geography tell us about its importance as a subject, for life on earth and why everyone should study geography in their life.


The study of geography is about more than just memorizing places on a map. It's about understanding the complexity of our world, appreciating the diversity of cultures that exists across continents. And in the end, it's about using all that knowledge to help bridge divides and bring people together. -Barack Obama

Geography is the subject which holds the key to our future. -Michael Palin

Physical geography and geology are inseparable scientific twins. - Roderick Murchison

What makes a nation in the beginning is a good piece of geography. - Robert Frost

Everywhere's been where it is ever since it was first put there. It's called geography. -Terry Pratchett

Geography should be the ultimate deciding factor for every political dilemma for proximity to an ailing land is bound to result in one's infection. -Aysha Taryam

Geography prepares for the world of work - geographers, with their skills of analysis are highly employable! -Michael Palin

Geography is the study of earth as the home of people. - Yi-Fu Tuan

Geography is the key, the crucial accident of birth. A piece of protein could be a snail, a sea lion, or a systems analyst, but it had to start somewhere. This is not science; it is merely metaphor. And the landscape in which the protein "starts" shapes its end as surely as bowls shape water. -Annie Dillard

It is impossible to understand history, international politics, the world economy, religions, philosophy, or ‘patterns of culture’ without taking geography into account.- Kenneth C. Davis

Without geography you're nowhere.- Jimmy Buffett

If you know a country's geography, you can understand and predict its foreign policy.- Napoleon Bonaparte

In our changing world nothing changes more than geography.- Pearl S. Buck

If geography is prose, maps are iconography. -Lennart Meri

Geography is the art of the mappable. -Peter Haggett


Thursday, August 20, 2020

Windy

This amazing weather web page can show real time weather phenomenon. It shows atmospheric variables like wind speed, wind direction, wind gusts, rain, thunder, temperature, cloud cover, waves, air quality. It also shows forecasts of weather. Click on the yellow icon on right corner to visualize other weather variables. Visit the website here.

Local Winds of India


Map of Local winds India, Bordoli Chheerha, Mango Showers, Loo, Elephanta

Winds are atmospheric phenomenon attributable to difference in temperature and atmospheric pressure. They are significant component in establishing and regulating the weather and climate of a particular place as well as of global atmospheric phenomenon. Winds operate in different climatic scale in terms of its spatial and temporal aspects. They operate at planetary scale known as planetary winds; seasonal scale known as seasonal or periodic winds and regional scale known as local winds.

Local winds are winds with limited spatial and temporal scale as they effect a limited area and operates over a shorter period of time. There are many ways in which local winds effect the weather and climate of a particular places. Many local winds blow over different regions of India. The influence of these local winds ins not only limited to the climate and weather but also shapes the economic, cultural and social characteristics of the region. 

Local winds of India –

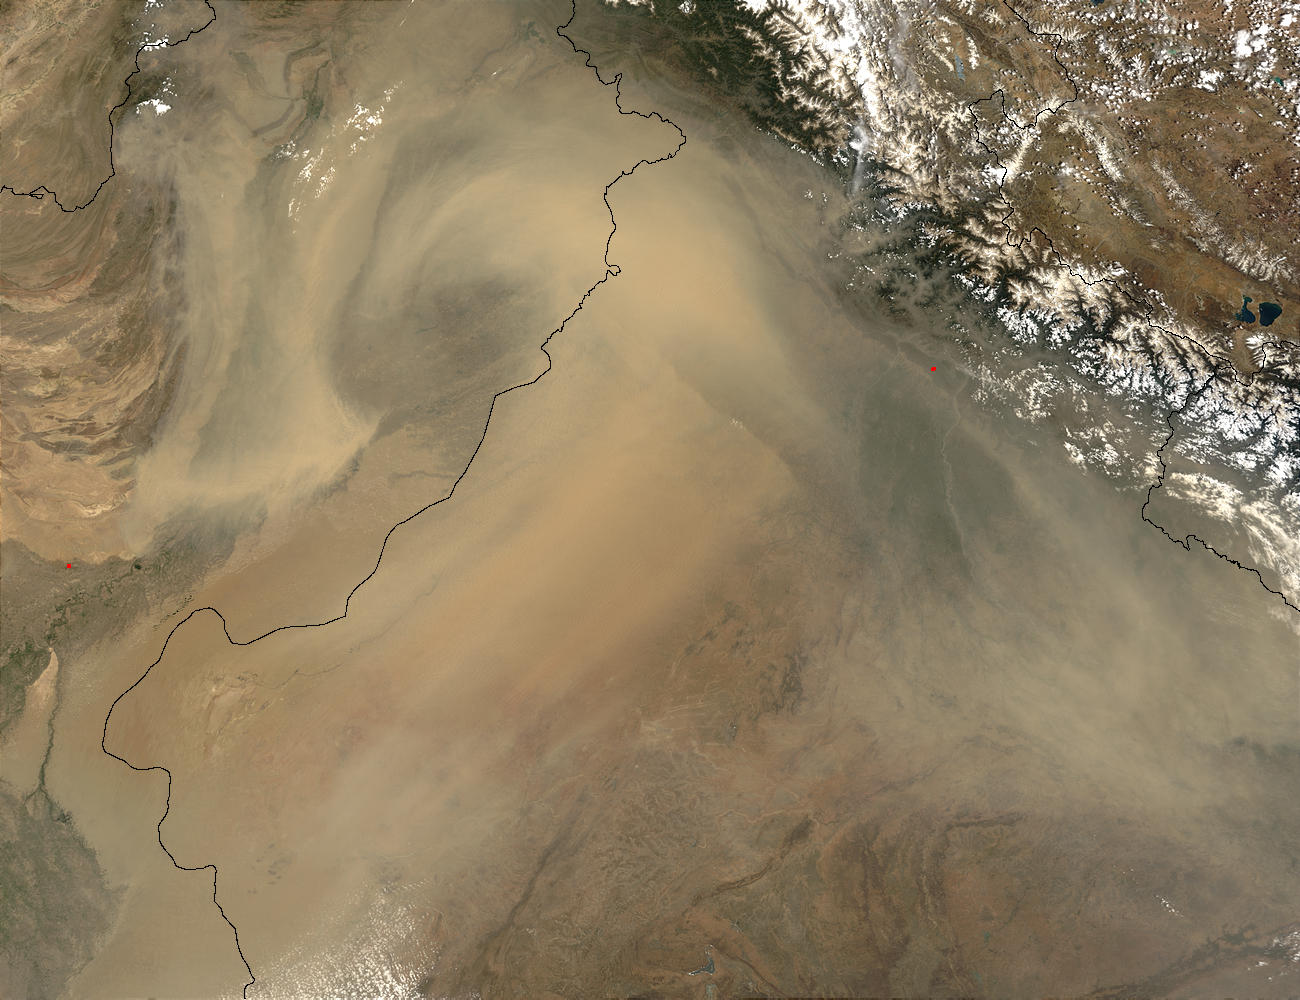
Aandhi, also known as Kali Aandhi are dust storms affecting the north western and central part of India. These storms are formed due to development of strong pressure gradient in the region late spring before monsoon season. Due to high surface heating in the dry Arabian Peninsula and the Thar desert, the loose soil/sand particles are transported through westerly winds to northern- central India (Middleton, 1986). These dust storms may become ferocious and cause destruction to life and property. The level of pollution in many urban centres like Delhi rises and the amount of suspended particles increase in air.


MODIS TERRA satellite image showing thick dust storms over India and Pakistan on June 9, 2003. Image courtesy - NASA


Loo are hot, dry winds blowing throughout the daytime in north and western India during the month of May and June. Loo winds are developed due to formation of the Monsoon Low Pressure Trough in northern India. To maintain balance, the hot dry winds of the surrounding areas move in causing formation of Loo. These dry winds are responsible for loss of life due to dehydration. However, it has some positive influences as it facilitates the process of separating the chaff from the grain. There is also decline in number of insect borne disease like malaria due to decrease in mosquito population.


Kalbaisakhi winds hitting Kolkata on 24 May, 2010. Photo Courtesy - Biswarup Ganguly, Wikipedia

 
Kalbaisakhi are the local winds affecting the eastern Indian states of West Bengal, Assam, Bangladesh and parts of Odisha and Bihar. It is known as different names in different states. Kal- Baisakhi means 'a fateful thing' in the month of Baisakh (Roy and Chatterji, 1929). In Assam, these are called Tea showers and Bordolichilla, and in Odisha as Bordoisila or Bardoli Chhera. These pre-monsoonal winds originate in the Chhota Nagpur plateau and blows eastwards under the influence of Westerlies. These warm winds when come in contact with moisture laden air and moves over elevated Himalayas in Assam and North Bengal, results in sudden rise in wind speed, lightning, thunder and hail and sometimes destructive tornadoes. It can cause destruction by uprooting trees and small houses. But then again, they sustain the pre-kharif crops like jute and paddy, and a large number of vegetables and fruits till summer season.

Mango showers are rains bearing local winds known with many different names as April rains, summer showers, coffee showers and cherry blossom showers. Names with cultivation prefix has been given to these light rains as it is beneficial for their growth. These pre-monsoonal winds are mainly experienced in south India prevailing along the coast of Kerala, Karnataka and parts of Tamil Nadu. They originate in the Bay of Bengal as the result of thunderstorm development.

Elephanta is a post monsoonal local wind impacting the Malabar coast of India. These are south easterly moisture laden winds which announces the beginning of dry season after monsoons and end of the rainy season. 

If you are more interested in winds; Earth, Windy, Windfinder are web based utilities which visualizes winds with wind direction, speed and other weather variables.

References - 

Middleton, N.J. (1986), A geography of dust storms in South‐West Asia. J. Climatol., 6: 183-196. doi:10.1002/joc.3370060207
Roy, S., Chatterji, G. Origin of Nor'westers. Nature 124, 481 (1929). https://doi.org/10.1038/124481a0